In short
The best time to trade forex is usually the London-New York overlap, 2 pm to 6 pm Paris time (8 am to 12 pm New York): activity is high and spreads are tight. But an active market is not a profitable one for you. Your best hour is measured in your own history, in two-hour blocks, on enough trades.
Key takeaways
- The London-New York overlap runs from 2 pm to 6 pm Paris time, and starts at 1 pm during the few weeks when Europe and the United States are not on the same seasonal clock.
- High activity generally narrows the spread, but it says nothing about how profitable your strategy is at that moment.
- In our simulation, a strategy that is identical at every hour shows at least one losing time block in 80% of cases over 300 trades, by pure chance.
- Measure each trade at its open time, converted from server time to a fixed reference time, and group hours into two-hour blocks.
- Before cutting a time slot, require at least 30 trades, a negative result in both halves of your history and a gap larger than statistical noise.
You have read everywhere that the best time to trade is the London-New York overlap. You started trading it, and your results did not move. That is normal: this advice describes the market, not you.
The best time to trade is the window where your strategy produces its best expectancy, costs included. It is not necessarily the one where the market moves most. This article first gives you the real markers, in Paris time and New York time, then the method to find your own hours without getting fooled by chance.
What is the best time to trade forex?
In forex, the most active window is the London-New York overlap, from 2 pm to 6 pm Paris time. The two largest centers are open at once, which is why everyone recommends it.
Two solid sources confirm it, with no broker blog involved:
- The weight of London. According to the 2025 Triennial Survey by the Bank for International Settlements, the United Kingdom accounts for 38% of the $9.6 trillion traded each day on the foreign exchange market.
- The overlap effect. Takatoshi Ito and Yuko Hashimoto studied EUR/USD and USD/JPY quotes and deals on the EBS interbank platform from 1999 to 2001 (NBER, 2006). The share of deals between London and New York is the highest. When the number of deals rises, the spread tightens. It then widens after 16:00-17:00 GMT, with a peak around 21:00-22:00 GMT.
This data is old and interbank: your broker does not quote the same spreads. The mechanism still holds: more participants, lower cost to get in.
The figure you often read, “more than 50% of volume happens during the overlap”, has no primary source that we could trace. Do not take it for granted.
Which time slots should you remember in Paris time?
Remember four moments: 9 am for London, 2 pm for New York, 2:30 pm and 3:30 pm for US moves, 11 pm for the end of the market day. The table gives Paris time in both possible situations. If you are elsewhere, use the reference column.
| Marker | Reference time | Paris, usually | Paris, offset weeks |
|---|---|---|---|
| Tokyo open | 9 am Tokyo | 1 am in winter, 2 am in summer | 1 am |
| London open | 8 am London | 9 am | 9 am |
| Overlap starts | 8 am New York | 2 pm | 1 pm |
| US jobs report (BLS) | 8:30 am New York | 2:30 pm | 1:30 pm |
| NYSE open | 9:30 am New York | 3:30 pm | 2:30 pm |
| Overlap ends | 5 pm London | 6 pm | 6 pm |
| Market close | 5 pm New York | 11 pm | 10 pm |
Session opening times are conventions: over-the-counter forex has no bell. The BLS and NYSE times, on the other hand, are official.
Offset weeks are those when the United States and Europe are not on the same seasonal clock. In 2026, the United States changed its clocks on March 8 and November 1 (NIST), Europe on March 29 and October 25. So from March 8 to 29 and from October 25 to November 1, everything that follows New York arrives one hour earlier in Paris.
Many guides write that the overlap moves to 3 pm-7 pm Paris time in summer. That is wrong: Paris and New York both move forward, and the gap stays at 6 hours.
Is the most active window the most profitable?
No. An active window lowers your cost to get in and increases the size of moves, but it does not guarantee that your strategy works there. Ito and Hashimoto show that volatility follows activity, so a mean-reversion strategy may get stopped out more often at 3:30 pm than at 11 am Paris time.
The overlap tells you when the market is active. It does not tell you when you are profitable.
The spread weighs in proportion to your stop. That is the calculation trading-hours guides never do. An illustrative example, with a strategy making +0.125R per trade when the spread is 1 pip:
| Stop | 1 pip spread | 3 pip spread | Extra cost | Expectancy after extra cost |
|---|---|---|---|---|
| 10 pips | 0.10R | 0.30R | 0.20R | −0.075R |
| 25 pips | 0.04R | 0.12R | 0.08R | +0.045R |
| 50 pips | 0.02R | 0.06R | 0.04R | +0.085R |
With a tight stop, your wide-spread hours alone can push a strategy from positive to negative. With a wide stop, the hour weighs far less on this cost. The same window can be good for a swing trader and bad for a scalper.
How do you find your best hour in your own history?
Export your trades, convert the open time to one fixed reference time, group by two-hour blocks, then calculate the average result in R for each block. Here is the step-by-step method, in any spreadsheet.
- Export your full history (from MT4 or from MT5) and keep closed trades only, without deposits or withdrawals.
- Use the open time, not the close time. That is when you made the decision. A report sorted by close time would assign a morning trade to the afternoon.
- Extract the hour. On a date formatted
2026.10.02 14:30:00and stored as text:=VALUE(MID(A2,12,2)). If the cell is a real date:=HOUR(A2). - Convert to your reference time. The MQL4 documentation states that orders are timestamped in the broker’s server time. Compare the Market Watch clock with your watch to find the offset. With the hour in B2 and a 1-hour offset:
=MOD(B2-1,24)in C2. - Create the two-hour block:
=INT(C2/2)*2. A result of 14 means the 2 pm-4 pm block. - Calculate each trade’s result in R. If you have no R, divide your P&L, net of commission and swap, by your usual risk in money terms.
- Build a pivot table: by block, the number of trades and the average result in R. Add the win rate if you like, but decide on the average result: a window with 65% winners can still lose money.
For step 4, many brokers align their server with the New York close. Darwinex, for example, shows GMT+3 during US daylight saving time and GMT+2 the rest of the year. In that case:
| Period | Server time 3 pm | Formula to Paris time |
|---|---|---|
| Outside offset weeks | 2 pm in Paris | Server time − 1 |
| Offset weeks | 1 pm in Paris | Server time − 2 |
Not all brokers follow this rule. Check yours once in winter and once in summer. If it stays on a fixed GMT offset, your hours shift by one hour against the market depending on the season, and your analysis blends two different windows.
How many trades does it take to trust an hour?
Far more than you think: at 300 trades, your hour ranking is still mostly noise. To show this, we simulated a strategy that is strictly identical at every hour: 45% winners, +1.5R or −1R, so +0.125R per trade, spread over six two-hour blocks, 40,000 times. No window is really better than another.
| Total trades | Per block | Apparent best block | Apparent worst block | At least one negative block |
|---|---|---|---|---|
| 120 | 20 | +0.49R | −0.23R | 90% of cases |
| 300 | 50 | +0.35R | −0.10R | 80% of cases |
| 600 | 100 | +0.28R | −0.03R | 63% of cases |
| 1,200 | 200 | +0.24R | +0.01R | 37% of cases |
| 2,400 | 400 | +0.20R | +0.05R | 12% of cases |
Another result from the same simulation: the best block in the first half of the history makes only +0.125R in the second half. Its lead vanishes, because it never existed.
To separate signal from noise, apply three conditions to a losing block:
- At least 30 trades in the block.
- Block average + 2.6 × σ / √n stays below the overall average, where σ is the standard deviation of all your results in R and n the number of trades in the block. This is the confidence-interval logic described by NIST (see also trading expectancy), with 2.6 instead of 1.96 because you are comparing six blocks at once.
- A negative result in both halves of your history.
In our simulation, these three conditions give a false alarm in only about 1% of cases, against 80% at 300 trades if you just look for a negative block. They come at a price: a window that truly loses −0.30R is spotted in only 25% of cases at 300 trades, 62% at 600 and 95% at 1,200.
An illustrative example, over 600 trades with a standard deviation of 1.2R and an overall average of +0.09R:
| Block | Trades | Average result | Upper bound | Verdict |
|---|---|---|---|---|
| 8 am-10 am | 120 | +0.22R | Not applicable | Nothing to conclude |
| 10 am-12 pm | 130 | +0.18R | Not applicable | Nothing to conclude |
| 12 pm-2 pm | 90 | +0.12R | Not applicable | Nothing to conclude |
| 2 pm-4 pm | 110 | −0.25R | +0.05R | Below +0.09R: a signal, if both halves are negative |
| 4 pm-6 pm | 110 | +0.28R | Not applicable | Nice number, but not proven |
| 6 pm-8 pm | 40 | −0.30R | +0.19R | Above +0.09R: no proof |
The 6 pm-8 pm block looks like the worst, but it has only 40 trades: nothing can be said about it. The 2 pm-4 pm block, less dramatic, is the only one that deserves a decision. The other 490 trades average +0.16R, against +0.09R for the whole set. This calculation looks backward: it still has to be confirmed live.
What should you do if an hour really stands out?
Before cutting a window, check that the hour is really the cause. A losing hour often hides something else: a run of morning losses, a stop that is too tight, or a single symbol.
Joshua Coval and Tyler Shumway showed (Journal of Finance, 2005) that Chicago Board of Trade traders who had lost in the morning were about 16% more likely to take above-average risk in the afternoon. Your bad 3 pm window may simply be revenge trading after a failed morning. To find out, split that block’s trades between those taken after a loss and the others.
| What you see | What it means | What to do |
|---|---|---|
| Fewer than 30 trades in the block | No information | Keep measuring, change nothing |
| Block negative in one half only | Chance or a change in the market | Watch it over the next month |
| Block negative, all three conditions met | Serious signal | Remove the window from your plan, or halve your size, for 50 trades |
| Block losing mostly after a loss | A discipline problem, not a timing one | Set a stop rule after two losses |
| Block losing mostly on your tight stops | Spread cost | Avoid this window for this setup only |
| Block losing on a single symbol | A symbol problem | Drop the symbol at this hour, not the whole hour |
| Very positive block, unproven | Maybe luck | Above all, do not raise your risk |
The thresholds of 50 trades and two losses are working markers, not research findings. Adjust them to how often you trade. Once the window is removed, compare your average result before and after: that is the only test that counts.
What is the best time to trade gold or crypto?
For gold, the markers are the LBMA auctions at 10:30 am and 3 pm London time, or 11:30 am and 4 pm in Paris all year round. For Bitcoin, the reference study finds lower activity in the evening and at weekends, and no return window that holds up over time.
The study by Dirk Baur and his coauthors (Finance Research Letters, 2019) covers more than 15 million observations from seven exchanges. It finds return anomalies by hour, but no persistent effect over time. Activity, on the other hand, shows lasting differences. In other words: liquidity hours are a reliable marker, “magic” profit hours far less so.
The method stays the same for both markets. Just separate each asset in your table, because a profitable hour on EUR/USD says nothing about gold.
Measuring your hours with Tradeven
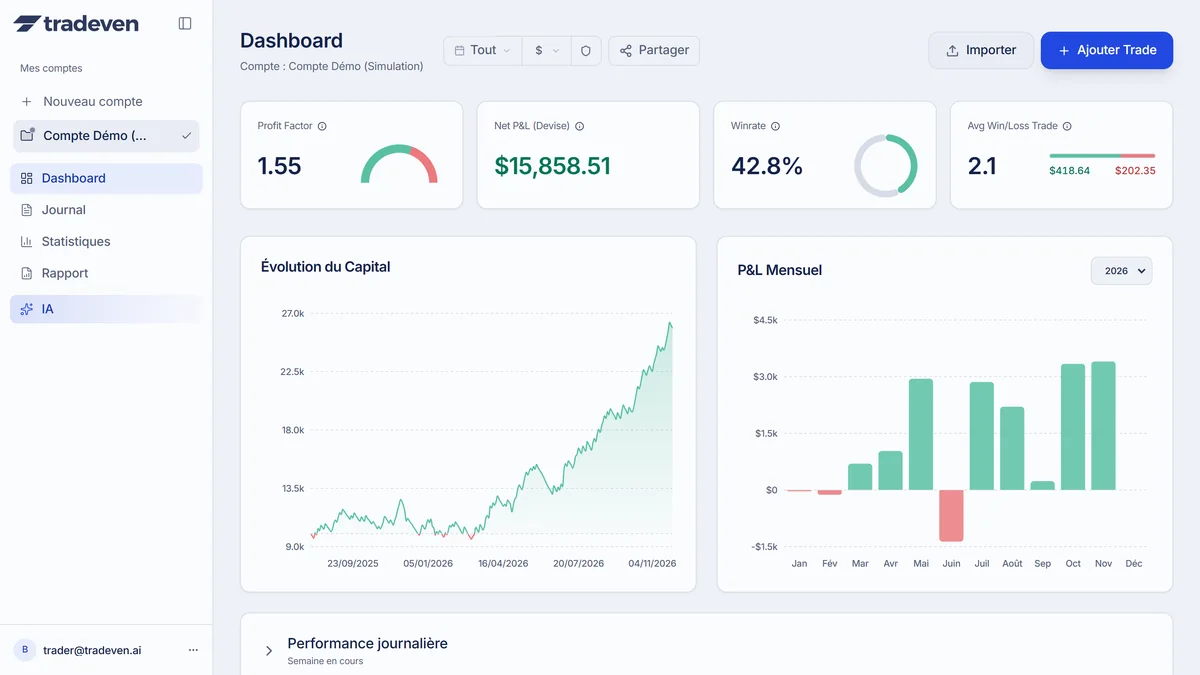
Tradeven does the grouping steps for you from your MT4, MT5, cTrader or TradingView file. The Temporal tab (Pro plan) shows P&L by hour, a day-by-hour performance heatmap, and your best and worst hours, based on entry time.
The analysis also flags hours where your win rate is above 65% with a positive average result, or below 40% with a negative average result, from 5 trades in that hour. At that level, treat it as a lead and confirm it with the three conditions above. Tradeven does not align your hours with market hours: check the offset on a trade whose time you know.
Frequently asked questions
05What is the best time to trade forex?
The most active window is the London-New York overlap, from 8 am to 12 pm New York time, or 2 pm to 6 pm in Paris. It starts at 1 pm Paris time during the offset weeks in March and late October. That is a liquidity marker, not a promise of profit. The right hour for you depends on your strategy and is checked in your history.
What is the best time of day to trade as a beginner?
Pick a short, fixed window that fits your schedule, on a liquid pair. Avoid starting on the 8:30 am New York data releases and on the end of the New York day, when spreads widen. Then record your results by time slot: a stable habit can be measured, random screen time cannot.
Does the overlap change with daylight saving time?
Barely, in Paris terms. Europe and the United States both change their clocks, so the overlap stays at 2 pm to 6 pm Paris time in summer and winter. It starts at 1 pm only when the two zones are out of step: March 8 to 29 and October 25 to November 1 in 2026.
What is the best time to trade gold?
Gold has two official markers: the LBMA auctions at 10:30 am and 3 pm London time, which are 11:30 am and 4 pm in Paris. The second falls during the London-New York overlap. These mark activity only: check your gold results as a separate symbol, because they cannot be inferred from your currency results.
How many trades do I need to know which hour is most profitable for me?
At least 30 trades per block to start looking, and closer to 100 to decide. In our simulation, a time slot that truly loses −0.30R is only spotted reliably at around 1,200 trades in total over six blocks. Below that, treat the result as a lead to watch.
Sources
13- Ito T. and Hashimoto Y., Intra-Day Seasonality in Activities of the Foreign Exchange Markets, NBER Working Paper 12413 (2006)
- Bank for International Settlements, Triennial Survey: FX trading at $9.6 trillion per day (2025)
- Baur D., Cahill D., Godfrey K. and Liu Z., Bitcoin time-of-day, day-of-week and month-of-year effects in returns and trading volume, Finance Research Letters (2019)
- Coval J. and Shumway T., Do Behavioral Biases Affect Prices?, The Journal of Finance (2005)
- U.S. Bureau of Labor Statistics, Employment Situation (released at 8:30 am Eastern)
- NYSE, Holidays and Trading Hours
- LBMA, Precious Metal Prices (gold auctions at 10:30 and 15:00 London time)
- NIST, Daylight Saving Time (2026 US dates)
- Service-public.gouv.fr (French government), Switch to summer time 2026
- MetaQuotes, MQL4 Book: Date and Time (local time and server time)
- Darwinex, Time in MetaTrader terminals (New York Close)
- FXCM, When is rollover booked? (5 pm New York time)
- NIST/SEMATECH, e-Handbook of Statistical Methods: Confidence Limits for the Mean
Educational content. It does not constitute investment advice. Trading leveraged products carries a high risk of losing your capital.