In short
Trading expectancy is the average result your strategy makes per trade: (win rate × average win) − (loss rate × average loss), or simply your total net result divided by the number of trades. Positive means your strategy wins in the long run. But over 50 trades, a genuinely winning strategy can show negative expectancy, and the reverse.
Key takeaways
- Expectancy is the average result per trade: (win rate × average win) − (loss rate × average loss), which equals your total net result divided by the number of trades.
- Express it in R, meaning multiples of the amount you risk, so you can compare periods and position sizes.
- A strategy that truly makes +0.2 R per trade shows negative expectancy over 50 trades in about 15% of cases, according to our simulation of 50,000 series.
- To know whether your expectancy is real, compute its confidence interval: average ± 1.96 × standard deviation ÷ square root of the number of trades.
- With 0.05 R of fees per trade, a strategy making +0.10 R gross needs about 1,860 trades before it can be told apart from luck.
Your strategy closed the last 40 trades in the green. You tell yourself it works. Maybe. Or maybe you had a good run, and the next 40 trades will take it all back.
Trading expectancy is the number that settles this question, as long as you do what almost nobody does: measure how much you can trust it. This guide gives you the formula, the calculation in R, a table showing how many trades you really need, and a method to measure it in your own trade history.
What is expectancy in trading?
Expectancy is the average result your strategy makes per trade, winners and losers combined. If it is positive, your strategy makes money in the long run. If it is negative, every trade costs you on average, even if you win often.
Trading platforms already compute it under another name. MetaTrader 5 calls it “Expected Payoff” in its testing report: according to MetaQuotes’ official help, it is the average return of a trade, also considered the expected return of the next position. TradingView calls it “Expected payoff” too, and its help center states that it is the total Net PnL divided by the number of closed trades, without open positions.
The key word is “average”. Expectancy says nothing about your next trade. It tells you what you get on average if you repeat the same strategy many times.
How do you calculate the expectancy of a strategy?
There are two formulas, and they give exactly the same result:
- The detailed formula: expectancy = (win rate × average win) − (loss rate × average loss).
- The shortcut: expectancy = total net result ÷ number of trades.
The first one helps you understand where your result comes from. The second one is faster and avoids rounding errors.
Illustrative example. Over 100 trades, you win 40 with an average win of €200 and lose 60 with an average loss of €100.
- Detailed formula: (0.40 × 200) − (0.60 × 100) = 80 − 60 = +€20 per trade.
- Shortcut: (40 × 200 − 60 × 100) ÷ 100 = 2,000 ÷ 100 = +€20 per trade.
Why express it in R rather than in money
One R is the amount you risk on a trade: the distance between your entry and your stop loss multiplied by your size. A trade that makes €200 for €100 at risk is +2 R. A trade that hits its stop is −1 R.
In R, expectancy becomes comparable from one period to the next, even if you changed your position size or your capital. In the example above, with 1 R = €100, expectancy is (0.40 × 2) − (0.60 × 1) = +0.2 R per trade. That is the unit used in the rest of this article. If you are not sure yet how much to risk per trade, start with this article on risk per trade.
Why doesn’t a high win rate guarantee positive expectancy?
Because expectancy depends as much on the size of your wins and losses as on how often they happen. A trader who wins 7 times out of 10 but loses twice as much as they win has barely positive expectancy, and fees push it below zero.
Real data shows it. In 2011, a study published by DailyFX on 12 million real trades by clients of a large Forex broker found that 59% of EUR/USD trades were winners. But the average win was 65 pips and the average loss 127 pips. Expectancy is therefore (0.59 × 65) − (0.41 × 127) = 38.4 − 52.1 = about −13.7 pips per trade. A flattering win rate, a losing strategy.
This is the trap the article on win rate covers in detail, with the break-even threshold for each reward ratio. Keep one thing in mind here: never judge a strategy on its win rate alone. Judge it on its expectancy.
How many trades do you need to trust your expectancy?
Many more than most traders think: often several hundred. The exact number depends on two things, the size of your expectancy and how spread out your results are. The more irregular your wins and losses, the more trades it takes for the average to settle.
For five strategy profiles that all have genuinely positive expectancy, we computed two things: the probability that you still observe negative expectancy over a given sample (simulation of 50,000 series per profile), and the number of trades from which the 95% confidence interval no longer contains zero. Every profile loses 1 R when it loses.
| Profile | Win rate | Average win | True expectancy | Negative expectancy observed over 50 trades | Over 100 trades | Trades to exclude zero |
|---|---|---|---|---|---|---|
| A | 40% | 2 R | +0.20 R | 15.5% | 9.0% | 208 |
| B | 50% | 1.2 R | +0.10 R | 24.1% | 18.4% | 465 |
| C | 55% | 1 R | +0.10 R | 19.8% | 13.3% | 381 |
| D | 35% | 3 R | +0.40 R | 6.7% | 1.2% | 88 |
| E | 60% | 1 R | +0.20 R | 5.7% | 1.6% | 93 |
Read row B: a strategy that truly makes 0.1 R per trade shows negative expectancy over 50 trades almost one time in four. A trader who drops it after 50 trades may be throwing away a winning strategy. And the other way round, a zero-expectancy strategy regularly shows positive expectancy over 50 trades, by pure chance.
Expectancy measured over 50 trades is not proof. It is an estimate, and its margin of error is often larger than the number itself.
The rules you read everywhere (“30 trades is enough”, “100 trades minimum”) ignore your strategy. The table shows that a very steady strategy like E can be judged in about a hundred trades, while a low-expectancy strategy like B needs nearly five times more.
How to measure expectancy in your own trade history
The method fits in a spreadsheet, starting from your history exported from MetaTrader 4, MetaTrader 5, cTrader or TradingView. It gives you your expectancy and its margin of error.
- Export your closed trades with the net result of each trade, commission and swap included. On MT4 and MT5, these columns are separate from profit: add them up.
- Add an R column: net result ÷ amount at risk on that trade. If you always risk the same amount, just divide by that amount.
- Compute the average of the R column. That is your expectancy. In Excel:
=AVERAGE(range). - Compute the standard deviation of the R column:
=STDEV.S(range). - Compute the standard error: standard deviation ÷ square root of the number of trades,
=STDEV.S(range)/SQRT(COUNT(range)). - Build the 95% confidence interval: expectancy ± 1.96 × standard error. This is the confidence interval for a mean described in the NIST statistics handbook, with 1.96 as an approximation that holds from a few dozen trades.
If the lower bound is above zero, your positive expectancy is probably real. If the interval contains zero, you do not know yet.
Full illustrative example. You have 120 trades. Your expectancy is +0.16 R and the standard deviation of your results is 1.4 R.
- Standard error: 1.4 ÷ √120 = 0.128 R.
- 95% margin: 1.96 × 0.128 = 0.25 R.
- Interval: from −0.09 R to +0.41 R.
With 1 R = €50, these 120 trades made you +€960, or +€8 per trade. Yet the interval contains zero: your strategy may be neutral. With the same expectancy and the same standard deviation, you would need about 295 trades for the whole interval to sit above zero. That does not mean you should stop. It means you should not raise your position size based on these 120 trades.
What is a good expectancy in trading?
There is no official threshold, but a good expectancy is one that is positive after fees and measured over enough trades for the confidence interval to exclude zero. The number alone matters less than how solid it is.
Here are reading guides, to apply to your expectancy after fees:
| Net expectancy per trade | Reading | What you do |
|---|---|---|
| Below 0 R | Losing strategy over the period | Stop or cut size sharply, then find where it loses |
| 0 to +0.1 R | Fragile: fees and slippage can wipe it out | Check fees and collect more trades before any change |
| +0.1 to +0.3 R | Workable if the sample is large enough | Compute the confidence interval before raising risk |
| Above +0.5 R over fewer than 100 trades | Probably luck or a favourable period | Wait for more trades before believing it |
Fees are why the 0.1 R threshold matters. The 2014 study by the AMF, France’s financial markets authority, on retail clients trading Forex and CFDs in France found that fees, excluding spread, made up 14.2% of their losses. In our table, 0.05 R of fees per trade takes strategy B from +0.10 R to +0.05 R, and the number of trades needed to tell it apart from luck rises from 465 to about 1,860. Strategy A goes from +0.20 R to +0.15 R and from 208 to 369 trades.
If you compute your expectancy from the MetaTrader Profit column alone, without commission or swap, your number is too optimistic. It is the same mistake as with the profit factor.
How to improve your expectancy without fooling yourself
The most reliable way to improve your expectancy is to cut what drags it down, not to add rules. To find it, compute the expectancy of each setup separately.
Illustrative example. Your 120 trades at +0.16 R break down like this:
| Setup | Trades | Expectancy | Total contribution |
|---|---|---|---|
| Breakout | 50 | +0.30 R | +15.0 R |
| Pullback | 45 | +0.16 R | +7.2 R |
| Counter-trend | 25 | −0.12 R | −3.0 R |
| Total | 120 | +0.16 R | +19.2 R |
Without the 25 counter-trend trades, the expectancy of the remaining 95 trades rises to 22.2 ÷ 95 = +0.23 R. But watch out for two traps:
- 25 trades is very few. The counter-trend setup’s expectancy has a huge margin of error. Do not delete it on this number alone: pause it, or halve its size, and keep measuring it.
- Do not slice endlessly. If you test 20 filters (hour, day, symbol, direction) and keep the best one, you will always find a winning combination by chance. Decide your categories before looking at the numbers.
The rule to apply from your next session: write down the setup of each trade when you take it, not afterwards. That is the basis of a trading journal that is actually useful, and the only way to compute an honest expectancy per setup.
What Tradeven computes for you
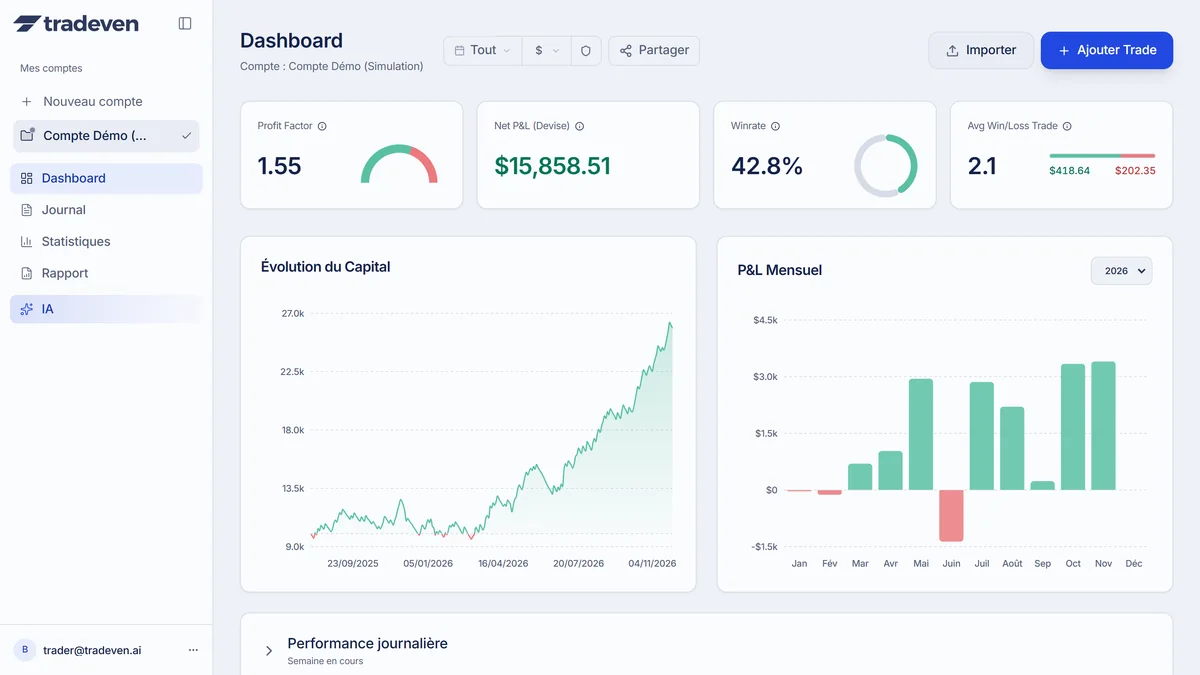
Tradeven imports your MT4, MT5, cTrader or TradingView history and computes your expectancy per trade, in currency or in R depending on the unit you choose. The Comparison tab puts the expectancy of two periods side by side, so you can see whether a change of method really improved your results. The Strategies tab computes the expectancy in R of each setup, for the trades you have assigned a setup to.
Two limits to know: the MetaTrader import takes the Profit column without adding commission and swap, and Tradeven does not show a confidence interval. For both points, the spreadsheet method above remains the reference.
Frequently asked questions
05How do you calculate trading expectancy?
Multiply your win rate by your average win, then subtract your loss rate multiplied by your average loss. With 40% winners at +2 R and 60% losers at −1 R, expectancy is +0.2 R per trade. The shortcut gives the same number: total net result divided by the number of trades.
What is a good expectancy in trading?
There is no official standard. Below 0.1 R per trade, fees and slippage can be enough to wipe it out. Between 0.1 and 0.3 R, the strategy is workable if it is measured over enough trades. Above 0.5 R over few trades, suspect luck or a short sample first.
How many trades do you need to know if a strategy is profitable?
It depends on your expectancy and on how spread out your results are. For a strategy with a 40% win rate and 2 R winners, you need about 210 trades for the 95% confidence interval to exclude zero. For a +0.1 R strategy with a 50% win rate, you need more than 460.
Why am I losing money with positive expectancy?
Three common causes: your expectancy is computed before fees (commission, swap and spread), your sample is too short for the number to be reliable, or you do not follow your strategy live the way you did in your backtest. Recompute it on your real trades, after fees, and look at its confidence interval.
What is the difference between expectancy and profit factor?
Expectancy tells you how much you make on average per trade, in money or in R. The profit factor tells you how much you make for every unit you lose. A strategy can have a decent profit factor and an expectancy too small to cover fees if it makes very little per trade.
Sources
05- MetaQuotes, MetaTrader 5 Help: Testing Report (Expected Payoff)
- TradingView Help Center, Expected payoff (2026)
- NIST/SEMATECH, e-Handbook of Statistical Methods: Confidence Limits for the Mean
- Rodriguez D. and Shea T., What is the Number One Mistake Forex Traders Make?, DailyFX (2011, archive)
- AMF (France's financial markets authority), study of retail investors' results trading CFDs and Forex in France (2014)
Educational content. It does not constitute investment advice. Trading leveraged products carries a high risk of losing your capital.