In short
The risk reward ratio compares the gain you target with the loss you accept: a 40-pip target and a 20-pip stop give a ratio of 2. On its own it creates no edge, because a further target is less likely to be hit. The number that matters is your realized ratio: your average win divided by your average loss.
Key takeaways
- The planned risk reward ratio is calculated before the trade: distance to target divided by distance to stop.
- The realized ratio is calculated afterwards: average win divided by average loss. This is the one that sets your minimum win rate.
- In a market with no edge, the probability of hitting the target equals stop ÷ (stop + target): a ratio of 3 wins 25% of the time and earns nothing before fees.
- In our model, with the same edge, closing at +1 R instead of +2 R lifts the win rate from 38.8% to 54% and cuts the average result in half.
- No ratio is good in itself: compare your actual win rate with the threshold 1 ÷ (1 + realized ratio), after fees, over at least 100 trades.
You set a 20-pip stop and a 40-pip target, and you tell yourself you trade at 2 to 1. Then you close a trade at +15 pips because price hesitates. You widen a stop because “it will come back”. At the end of the month, your account looks nothing like what your ratio promised.
This guide to the risk reward ratio goes beyond the formula. It shows you the difference between the ratio you aim for and the one you get, what each early exit costs, and how to measure your real ratio in your own history.
What is the risk reward ratio?
The risk reward ratio is the gain you target divided by the loss you accept on a trade. You calculate it before entering, from three prices: the entry, the stop loss and the take profit.
Ratio = |take profit − entry price| ÷ |entry price − stop loss|
Example: you buy EUR/USD at 1.1000, with a stop loss at 1.0980 (20 pips) and a take profit at 1.1040 (40 pips). The ratio is 40 ÷ 20, or 2. This result does not depend on your position size, which you set separately with the position size calculation.
The notation is confusing. IG Academy writes 1:2 for a gain twice the risk, while Capital.com writes 3:1 for a gain three times the risk. To stay clear, this guide talks about a ratio of 2: you target 2 for every 1 you risk.
Planned ratio, realized ratio, average result: what’s the difference?
The planned ratio describes your intention, the realized ratio describes what happened, and the average result tells you whether you make money. Guides nearly always discuss the first, yet only the other two show up in your account.
| Number | When | Formula | What it tells you |
|---|---|---|---|
| Planned ratio | Before the trade | Distance to target ÷ distance to stop | What you intend to do |
| Realized ratio | After a sample | Average win ÷ average loss | What you actually do |
| Average result | After a sample | Total result ÷ number of trades, in R or in euros | Whether your strategy pays |
TradingView defines the realized ratio the same way in its help pages: the average win relative to the average loss, on closed positions only. It also points out that this number ignores how often you win. That is why you read it alongside your win rate, and why trading expectancy remains the final judge.
Illustrative example. You risk €100 per trade with a planned ratio of 2. Over 100 trades, you win 45 times for an average of €110 and lose 55 times for an average of €120, because you close early and widen your stops.
| Calculation | What you believe | What happens |
|---|---|---|
| Ratio | 2 | 0.92 |
| Minimum win rate before fees | 33.3% | 52.2% |
| Your win rate | 45% | 45% |
| Result over 100 trades | Should be positive | −€1,650 |
The same 45% win rate looks comfortable against the first threshold and falls short of the second. This pattern is no exception: across more than 12 million trades analyzed by DailyFX in 2011, EUR/USD showed 59% winners, but an average loss of 127 pips against an average win of 65 pips. The full calculation is in our guide to win rate.
What is a good risk reward ratio?
No ratio is good in itself: it is good if it clears what your win rate requires. The minimum win rate is 1 ÷ (1 + ratio) before fees, which is 50% at a ratio of 1, 33.3% at 2 and 25% at 3.
The benchmarks you read everywhere remain opinions. IG recommends a ratio of at least 2, and Capital.com calls 10 to 1 too ambitious. We found no published study that proves a minimum ratio valid for all traders.
So the right habit is to start from your setup. A scalper who wins 65% of the time can live with a ratio of 0.8, as long as fees allow it. A trend follower who wins 30% of the time needs a realized ratio well above 2.3.
Does aiming for a higher ratio improve your results?
No, not by itself. Moving your target further away lowers the probability of reaching it, and in a market with no edge, the two effects cancel out exactly.
Random walk theory shows this. According to Columbia University course notes on the gambler’s ruin problem, a price moving at random reaches a level a before a level −b with a probability of b ÷ (a + b). Applied to a trade, that gives: probability of hitting the target = stop ÷ (stop + target). Tradeven calculation, with fees of 0.1 R per trade:
| Target ratio | Probability of hitting the target | Minimum win rate with fees | Average result before fees | Average result after fees |
|---|---|---|---|---|
| 0.5 | 66.7% | 73.3% | 0 R | −0.1 R |
| 1 | 50% | 55% | 0 R | −0.1 R |
| 2 | 33.3% | 36.7% | 0 R | −0.1 R |
| 3 | 25% | 27.5% | 0 R | −0.1 R |
| 5 | 16.7% | 18.3% | 0 R | −0.1 R |
Changing your ratio changes your win rate. Only a real edge changes your result.
The real market is not a perfect random walk, and that is exactly where your edge plays out. Kaminski and Lo (Journal of Financial Markets, 2014) show that a stop loss rule lowers expected return if prices follow a random walk, and that it can add value when momentum exists. The same principle applies to your target: it is only worth what your setup can do beyond chance.
How much do your early exits cost?
With a real edge, every exit ahead of plan lowers your average result, even when your win rate rises. With no edge, these exits change nothing before fees.
To put numbers on it, we modeled a trade with a −1 R stop and a +2 R target in a market with a slight constant edge (random walk, 20 steps per R, 50.2% favorable steps). The calculation is exact, and a simulation of 50,000 trades per scenario confirms it. This model is illustrative and describes no real market.
| Your behavior | Win rate | Realized ratio | Average result before fees | After 0.1 R of fees |
|---|---|---|---|---|
| Stop and target left alone | 38.8% | 2 | +0.16 R | +0.06 R |
| Stop to break-even at +1 R, target at +2 R | 29.2% (24.8% at zero) | 2 | +0.12 R | +0.02 R |
| Closing at +1 R | 54% | 1 | +0.08 R | −0.02 R |
| Stop widened to −1.5 R, closing at +1 R | 64.7% | 0.67 | +0.12 R | +0.02 R |
| Closing at +0.5 R | 69.3% | 0.5 | +0.04 R | −0.06 R |
Three takeaways:
- The most flattering win rate gives the worst result. Closing at +0.5 R wins you almost 7 trades out of 10 and leaves you losing after fees.
- The widened stop misleads you twice. It shows +0.12 R, but for a real risk of 1.5 R per trade. Relative to that risk, the result falls to +0.08 R.
- Break-even has a price. Your realized ratio stays at 2, your win rate falls, and a quarter of your trades end at zero.
This model has a limit: its edge never fades over time. On a mean reversion setup, where the move runs out quickly, exiting earlier may be the right choice. Only your history can settle it.
So why do people cut winners anyway? Terrance Odean studied 10,000 accounts at a US broker (Journal of Finance, 1998) and measured that gains were realized far more readily than losses: 14.8% of possible gains realized against 9.8% of possible losses. Cashing in feels good, and you pay for it in your ratio.
How do you measure your realized ratio on MT4, MT5 and TradingView?
Your realized ratio comes from two numbers in your history report, and the gap with your planned ratio takes a few minutes in a spreadsheet. Here is the method.
- Export your history. Follow our guide to MT4 history or MT5 history. Aim for at least 100 trades on the same setup.
- Calculate your realized ratio. Divide Average profit trade by the absolute value of Average loss trade. Both lines appear in MT4 and MT5 reports. In TradingView, the Strategy Tester report shows Average profit / average loss directly, but it describes a tested strategy, not your manual trades.
- Calculate your planned ratio. In a spreadsheet, for each trade with both an S/L and a T/P:
=ABS(TP-Entry)/ABS(Entry-SL). Take the average. - Sort your exits into three groups. Target hit, stop hit, manual exit. On MT4, the help pages state that the comment shows “[t/p]” or “[s/l]” when that order closed the position. On MT5, compare the closing price with the S/L and T/P columns.
- Calculate your capture rate. Realized ratio ÷ planned ratio. With 2 planned and 1 realized, you capture 50% of your plan.
Watch out for the S/L column trap: the history shows one value per position. If you moved your stop, do not take that value for your original stop, especially if it sits at the entry price. Your planned ratio and your R would both be wrong. The only reliable measure is to write down the stop and target before entering, in your trading plan or journal.
What should you do based on your gap?
Your action depends first on your average result, then on your capture rate. The thresholds below are our own reading benchmarks, not a standard.
| Your situation | What it means | Your next action |
|---|---|---|
| Capture above 80%, positive average result | You execute your plan | Change nothing without data |
| Capture below 60%, many manual exits in profit | You cut your winners | Write down one valid reason to exit before the target and compare both versions |
| Average loss above planned risk | Widened stops or slippage | Ban yourself from moving a stop further away, then check your position size |
| Targets rarely hit, even without intervention | Target too far for this setup | Test a closer target on your history, after fees |
| Good capture, zero or negative average result | Your ratio is not the problem | Go back to the setup: no exit setting creates an edge |
One rule for your next session: before entering, calculate 1 ÷ (1 + planned ratio) and compare that threshold with the win rate measured on this setup. If a trade at a ratio of 1.5 requires 40% and this setup wins 35% of the time, you let it go.
Tracking your ratio with Tradeven
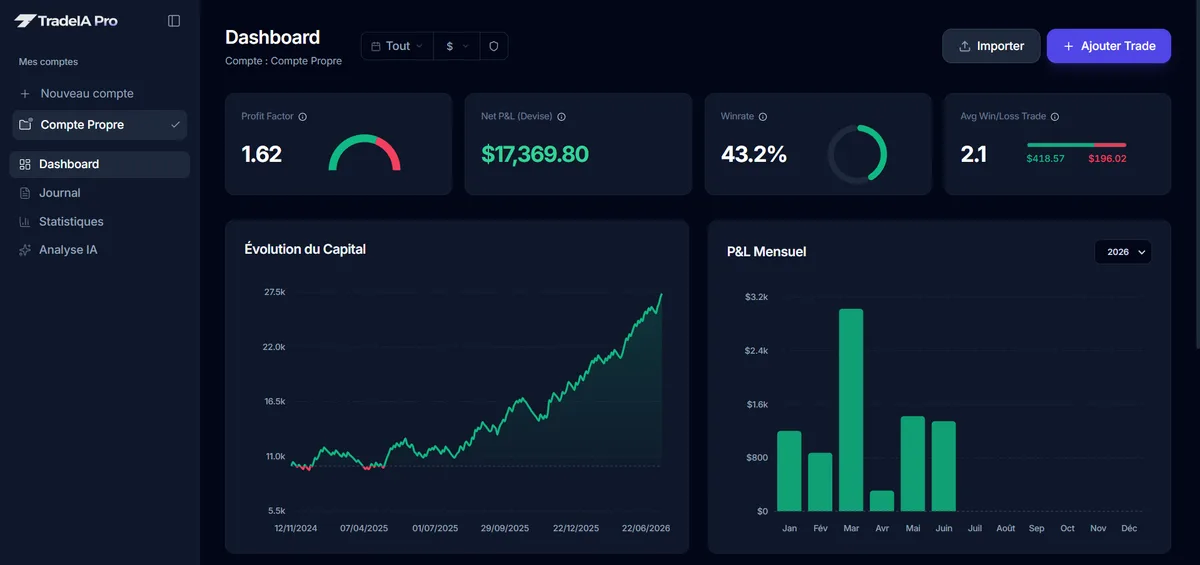
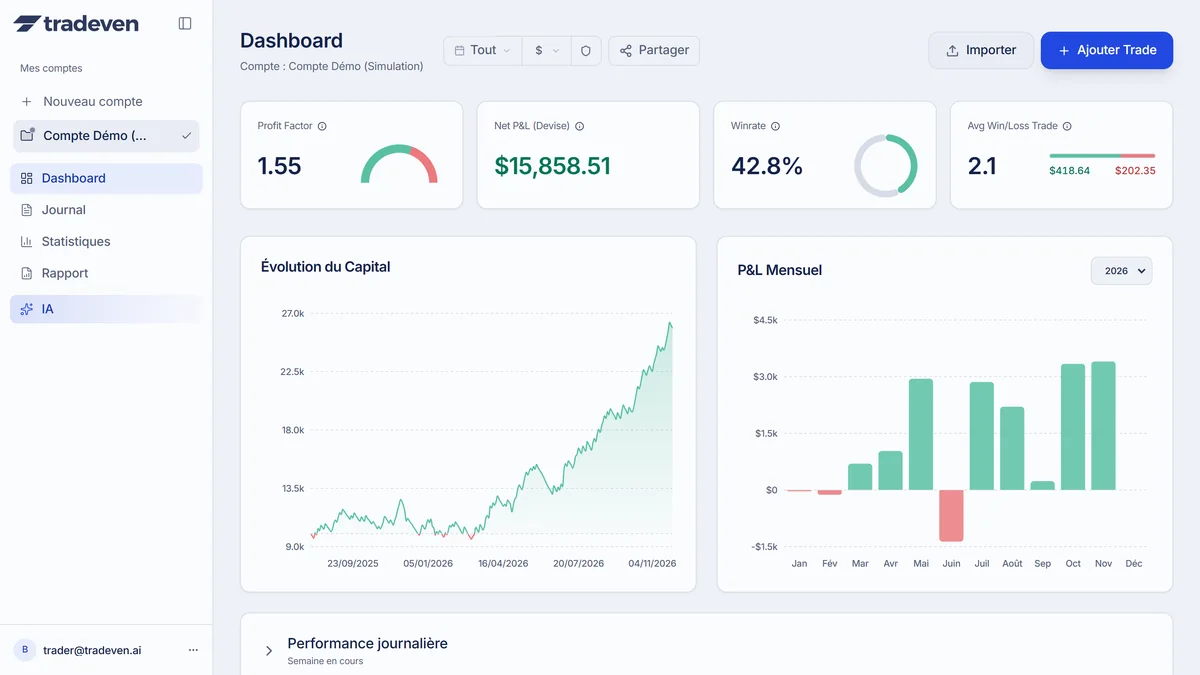
Tradeven shows your realized ratio on the dashboard (Avg Win/Loss Trade), plus your average win and loss in R per symbol. On MT4 or MT5 import, it reads the S/L and T/P columns and calculates your R from the stop in the file, so the moved stop trap applies here too, and fees are not included. The analysis flags when your average loss exceeds your average risk by 50%. Tradeven does not automatically compare your planned ratio with your realized ratio: you still calculate the capture rate yourself.
Frequently asked questions
05What is a good risk reward ratio in trading?
No ratio is good in absolute terms. A ratio of 1 works if you win well over 50% of your trades after fees, and a ratio of 3 is useless if you win fewer than 25%. The benchmark of 2 is a starting convention, not a proven threshold.
How do you calculate the risk reward ratio?
Divide the distance between your entry price and your target by the distance between your entry price and your stop. With an entry at 1.1000, a stop at 1.0980 and a target at 1.1040, you get 40 pips divided by 20 pips, a ratio of 2. Position size does not change this result.
Should you write 1:2 or 2:1?
Both are used for the same idea, depending on whether the author writes risk or reward first. IG Academy writes 1:2, and Capital.com writes 3:1 for a gain three times the risk. To avoid confusion, talk about a ratio of 2: you target 2 for every 1 you risk.
Should you move your stop to break-even as soon as possible?
Not automatically. In a market with no edge, it does not change the average result before fees. With a real edge, our model shows a cost: moving to break-even at +1 R lowers the average result from +0.16 R to +0.12 R. Test the rule on your own history before adopting it.
Can a 1 to 1 ratio be profitable?
Yes, if your win rate beats 50% by enough to pay for fees. With fees of 0.1 R per trade, you need more than 55% winners, measured on a sample large enough to clear the margin of error.
Sources
10- Columbia University, IEOR 4700, Gambler's Ruin Problem: random walk hitting probabilities
- Kaminski K. and Lo A., When Do Stop-Loss Rules Stop Losses?, Journal of Financial Markets (2014)
- Odean T., Are Investors Reluctant to Realize Their Losses?, The Journal of Finance (1998)
- Rodriguez D. and Shea T., What is the Number One Mistake Forex Traders Make?, DailyFX (2011, archive)
- MetaQuotes, MetaTrader 5 Help: Trading history report
- MetaQuotes, MetaTrader 4 Help: Account History
- TradingView Help: Average profit / average loss
- IG Academy, Balancing risk and reward
- IG France, What is the risk reward ratio? (in French)
- Capital.com, Understanding the risk/reward ratio (French edition)
Educational content. It does not constitute investment advice. Trading leveraged products carries a high risk of losing your capital.