In short
A trading plan is a written document that sets in advance your markets, hours, setups, risk per trade and loss limits. It only works if you follow it and measure it: write each rule in if-then form, check it against your MT4 or MT5 history and calculate what your off-plan trades cost you.
Key takeaways
- A trading plan sets before the session what you trade, when, with which setup, how much you risk per trade and when you stop.
- A useful rule is checkable: if your trade history cannot tell you whether it was followed, rewrite it.
- According to Gollwitzer and Sheeran's meta-analysis (2006, 94 tests), if-then plans clearly improve goal attainment.
- Your plan adherence rate is the number of compliant trades divided by your total trades, tracked every month.
- Compare the expectancy in R of compliant and off-plan trades: the gap puts a number on what your lack of discipline really costs.
- Change one rule at a time, and only after enough trades to judge the rule rather than luck.
You already have a trading plan. Maybe on paper, maybe in your head. The real problem is that it does not hold: two losses in a row, a move that leaves without you, and you end up trading something you never planned.
Most guides tell you what to put in a trading plan. This one shows you how to write rules you can check, with a one-page example, then how to measure in your own history what your deviations cost you.
What is a trading plan?
A trading plan is a written document that sets in advance what you trade, when, how and with how much risk. It is the reference you use afterwards to judge each trade: compliant or off-plan.
People often mix it up with a strategy or a journal. The three are linked, but they answer different questions.
| Tool | Question | Content | When you use it |
|---|---|---|---|
| Strategy | When do I enter and exit? | Setups, entry conditions, stop loss, take profit | During the trade |
| Trading plan | Within which limits do I trade? | Strategy + markets, hours, risk per trade, loss limits, review | Before the session |
| Journal | What did I actually do? | Each trade, its result, plan adherence, emotion | After the session |
The plan is the contract, the journal is the proof. Without a journal, you do not know whether you follow your plan. If you do not keep one yet, start with the trading journal guide.
Why do most trading plans get ignored?
A plan gets ignored when its rules are vague, too many or never measured. “Be disciplined” or “don’t trade on emotion” are not rules: at the moment you click, nothing tells you whether you are inside or outside them.
Psychology research offers a precise lead. “Implementation intentions” are plans written as “if this situation happens, then I do this”. Gollwitzer and Sheeran’s meta-analysis, published in 2006 across 94 independent tests, found a medium-to-large effect on goal attainment (d = 0.65). An update by Sheeran, Listrom and Gollwitzer, published in 2025 across 642 tests, confirms effects from d = 0.27 to 0.66, stronger when the plan uses a conditional if-then format and when it is rehearsed.
The second lever is monitoring. According to the meta-analysis by Harkin and colleagues (Psychological Bulletin, 2016), monitoring your progress improves goal attainment, and the effect is stronger when progress is recorded in writing.
A rule you cannot check in your trade history is not a rule, it is an intention.
The risky situations are well known. Coval and Shumway (Journal of Finance, 2005) observed that CBOT traders who lost money in the morning took more risk in the afternoon. That is exactly when an if-then rule written in a calm moment has to decide for you.
What should a trading plan include?
A complete trading plan fits in seven sections, each with numbered rules. If it runs longer than a page, you will not reread it before each session.
- Process goal: something you control, for example “90% compliant trades this month”. Not a profit target in dollars, which the market decides for you.
- Allowed markets: the closed list of symbols you trade. Everything else is off-plan.
- Hours: your trading window, and forbidden moments (major economic releases, for example).
- Setups: one to three setups described as observable conditions, with entry, stop loss and exit.
- Risk per trade: a fixed percentage of your capital, which defines your R. To choose the right level, see how much to risk per trade.
- Loss limits: a maximum number of trades per day, a daily loss and a weekly loss beyond which you stop.
- Review: how you mark each trade (compliant or off-plan) and when you review the numbers.
The 2014 study by the AMF, France’s financial markets authority, covering 14,799 active retail CFD and Forex clients, shows that 89% of them lost money over four years. A plan guarantees nothing, but without written loss limits, nothing stops a bad day before it turns into a bad week.
A one-page trading plan example
Here is an illustrative example for an intraday trader on Forex and one index. It is not a plan to copy as is: your markets, capital and setups are different. Focus on the shape of the rules.
Goal for the month: at least 90% compliant trades.
Markets: EUR/USD, GBP/USD, DAX. No other symbol.
Hours
- If Paris time is outside 9 am to 12 pm, then I take no trade.
- If a major release is due within 15 minutes, then I wait until it has passed.
Single setup: breakout then retest
- If price breaks the high or low of the first hour and then retests it on the 5-minute chart, then I enter in the direction of the breakout.
- The stop loss goes on the other side of the tested level, before entry. The take profit is at 2R.
- If price reaches +1R, then I may move the stop to break-even. Never before.
Risk
- 1% of capital per trade, which is 1R. If the stop requires a size above 1%, then I cut the size, not the stop.
- If I want to widen my stop during the trade, then I close the position.
Limits
- Maximum 3 trades per day.
- If I have 2 losses in the day or −2R in total, then I stop until the next day.
- If I reach −5R for the week, then I stop until the following Monday.
Review
- Each trade is marked compliant or off-plan the same evening, with the rule broken.
- Every month end: adherence rate, expectancy in R of both groups, one single decision.
Every line starts with “if” or with a number. That is what makes it checkable.
How do you check in your history whether you follow your plan?
You check your plan by matching each rule to a column of your trade history: open time, symbol, volume, result. First export your history from your platform (the method to export your MT4 history broadly applies to MT5 too), then add an “R” column equal to the result divided by your planned risk in money.
| Rule | What you look at | Off-plan if… |
|---|---|---|
| Allowed markets | Symbol | The symbol is not on the list |
| Hours 9 am to 12 pm | Open time converted to Paris time | The open is outside the window |
| 1% risk | Result in R of losing trades | A loss is clearly beyond −1R (widened stop or oversized position) |
| 3 trades per day | Number of opens per date | 4th trade or more in the day |
| Stop after 2 losses | Order of trades within the day | A trade is opened after the 2nd closed loss |
| Weekly limit −5R | Cumulative R per week | A trade is opened after reaching −5R |
The method, once a month:
- Convert the time. The MQL4 documentation states that MetaTrader orders are timestamped in the broker’s server time, not your own time. Work out the offset before testing the hours rule (the step-by-step conversion is here).
- Add a “compliant” column and go through every rule in the table. A single breach is enough to mark the trade off-plan.
- Write down the rule broken in a separate column. That is what tells you what to fix.
- Calculate your adherence rate: compliant trades divided by total trades.
- Calculate the expectancy in R of each group: sum of R divided by the number of trades.
Keep a reasonable tolerance on the risk rule: slippage can turn a −1R loss into −1.1R without any cheating on your part. Set your threshold in advance, for example −1.2R.
How much do your plan deviations cost you?
The cost of your lack of discipline is the result in R of your off-plan trades. If that number is negative month after month, your problem is not your strategy but how you execute it.
Illustrative example: one month of 80 trades, with a risk of €100 per trade (1R = €100).
| Group | Trades | Win rate | Result | Expectancy | In euros |
|---|---|---|---|---|---|
| Plan compliant | 62 | 41.9% | +10.8R | +0.17R | +€1,080 |
| Off-plan | 18 | 33.3% | −9.6R | −0.53R | −€960 |
| Total | 80 | 40.0% | +1.2R | +0.02R | +€120 |
The adherence rate is 62 out of 80, or 77.5%. The account ends the month at +€120, while the compliant trades alone made +€1,080. The 18 off-plan trades wiped out almost 90% of the gain.
Then break it down by rule broken, still in this example:
| Rule broken | Trades | Result |
|---|---|---|
| Outside trading hours | 7 | −3.1R |
| Trade after the 2-loss limit | 6 | −4.9R |
| Risk above 1% | 5 | −1.6R |
The most expensive rule here is the stop after two losses. It is the only one to work on next month, for example by closing the platform as soon as the second loss hits.
One caution: 18 trades is a small sample. A gap in results on such a small group can come from luck. Look at the trend over several months, and read trading expectancy to know from how many trades a number becomes reliable.
When should you change your trading plan?
Change your plan at most once a month, one rule at a time, and never during a session. Changing a rule after every loss is the same as having no plan.
Three situations justify a change:
- A rule is followed but loses money over a large enough sample. The rule is the problem, not you. Test a single variation.
- A rule is broken almost every session. It may be unrealistic for your schedule or temperament. Make it workable instead of continuing to ignore it.
- Your capital or situation changes. Risk per trade and loss limits need to be recalculated.
In every other case, the plan stays the same. A losing week in which you followed every rule is part of the game.
Tracking plan adherence with Tradeven
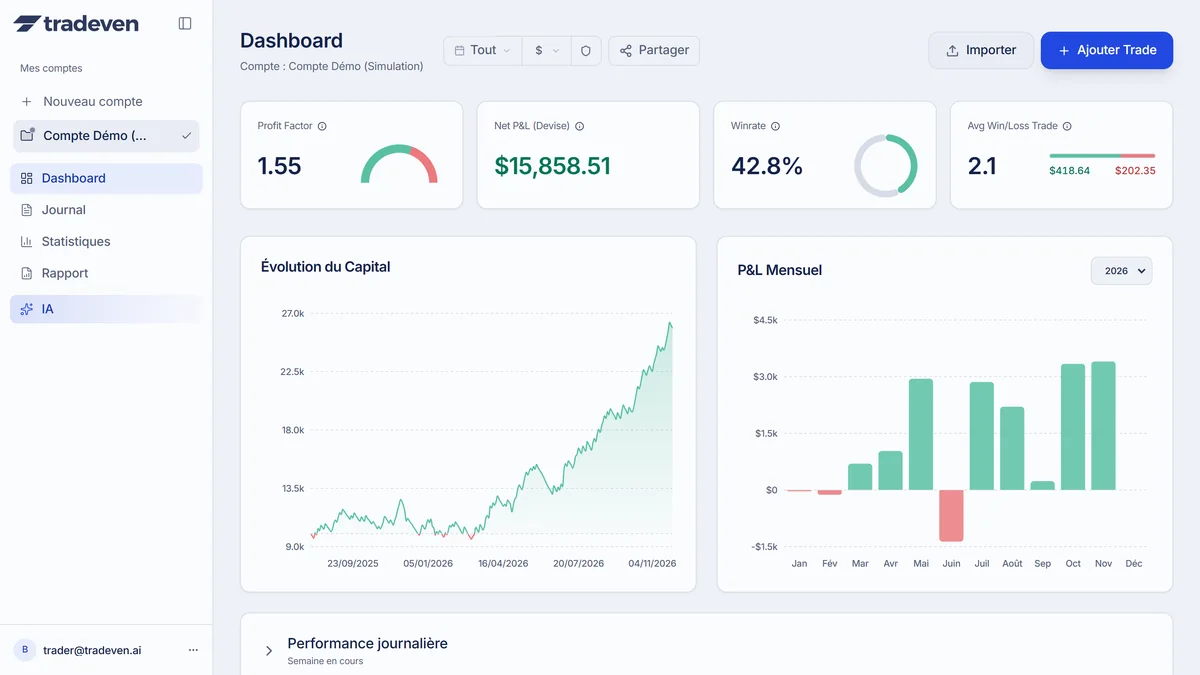
Tradeven imports your MT4, MT5, cTrader, TradingView or NinjaTrader history. For each trade, entered manually or imported and then edited, you can record whether you followed your plan (yes or no).
In the Psychology tab of the analysis, the “Discipline impact” block then compares trades that followed the plan, off-plan trades and unclassified trades: number of trades, win rate, P&L and result in R, along with the cost of indiscipline. Marking stays declarative: Tradeven does not read your plan and does not decide for you whether a trade complied with it.
Frequently asked questions
05What is a trading plan?
It is a written document that sets in advance the markets you trade, your hours, your entry and exit setups, your risk per trade and your daily and weekly loss limits. It is the reference you use to judge each trade: compliant or off-plan.
What is the difference between a trading plan and a trading strategy?
The strategy describes when to enter and exit a trade. The plan contains the strategy and adds everything else: risk per trade, loss limits, trading hours, allowed markets and how you review your results.
How do you stick to your trading plan?
Write precise rules in if-then form, keep it to one page and reread it before every session. Then mark each trade as compliant or off-plan and calculate your adherence rate and the result of off-plan trades every month. Seeing the cost of your deviations in R is often what changes the behavior.
Should a trading plan be a PDF or an Excel file?
The format matters less than the content. A printed page or a PDF is enough for the plan itself. Tracking adherence, however, needs a spreadsheet or a journal that matches each trade against your rules.
How often should you change your trading plan?
Not after a bad day or a bad week. Review it once a month, change one rule at a time and wait until you have enough trades under the new rule to judge it. Risk rules should change even less often.
Sources
07- Gollwitzer P. M. and Sheeran P., Implementation intentions and goal achievement: a meta-analysis of effects and processes, Advances in Experimental Social Psychology (2006)
- Sheeran P., Listrom O. and Gollwitzer P. M., The when and how of planning: meta-analysis of the scope and components of implementation intentions in 642 tests, European Review of Social Psychology (2025)
- Harkin et al., Does monitoring goal progress promote goal attainment? A meta-analysis of the experimental evidence, Psychological Bulletin (2016)
- Coval J. and Shumway T., Do Behavioral Biases Affect Prices?, The Journal of Finance (2005)
- AMF (French financial markets authority), Study of retail investors' results trading CFDs and Forex in France (2014)
- MetaQuotes, MetaTrader 4 Help: Account History and reports
- MetaQuotes, MQL4 Book: Date and Time (local time and server time)
Educational content. It does not constitute investment advice. Trading leveraged products carries a high risk of losing your capital.